Quick Start
Installation
Clone the repository and install the package with Poetry. Set up a new Python environment with Python >=3.9, <3.11 (e.g. using conda), activate it, and then run
pip install poetry
(unless Poetry has been installed already) and
git clone https://github.com/risc-mi/catabra.git
cd catabra
poetry install
The project is installed in editable mode by default. This is useful if you plan to make changes to CaTabRa’s code.
IMPORTANT: CaTabRa currently only runs on Linux, because
auto-sklearn only runs on Linux. On Windows,
you can use a virtual machine, like WSL 2, and install CaTabRa
there. If you want to use Jupyter, install Jupyter on the virtual machine as well and launch it with the --no-browser
flag.
Usage Mode 1: Command-Line
python -m catabra analyze example_data/breast_cancer.csv --classify diagnosis --split train --out breast_cancer_result
This command analyzes breast_cancer.csv and trains a prediction model for classifying the samples according to column
"diagnosis". Column "train" is used for splitting the data into a train- and a test set, which means that the final
model is automatically evaluated on the test set after training. All results are saved in directory breast_cancer_out.
python -m catabra explain breast_cancer_result --on example_data/breast_cancer.csv --out breast_cancer_result/expl
This command explains the classifier trained in the previous command by computing SHAP feature importance scores for
every sample. The results are saved in directory breast_cancer_result/expl. Depending on the type of the trained
models, this command may take several minutes to complete.
Usage Mode 2: Python
The two commands above translate to the following Python code:
from catabra.analysis import analyze
from catabra.explanation import explain

analyze("example_data/breast_cancer.csv", classify="diagnosis", split="train", out="breast_cancer_result")
explain("example_data/breast_cancer.csv", "breast_cancer_result", out="breast_cancer_result/expl")
Results
Invoking the two commands generates a bunch of results, most notably
the trained classifier
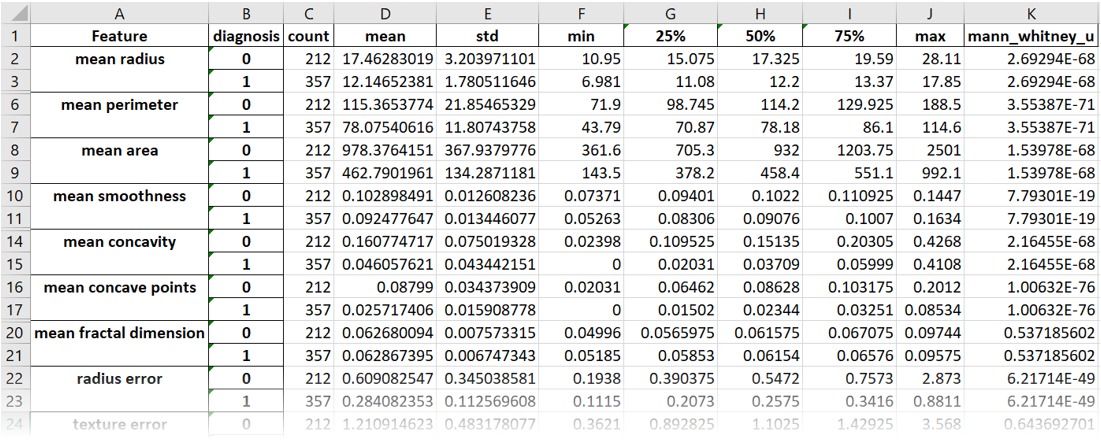
descriptive statistics of the underlying data
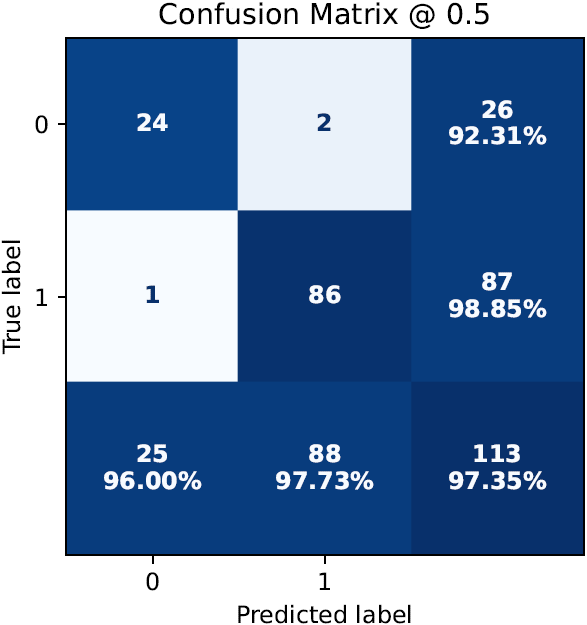
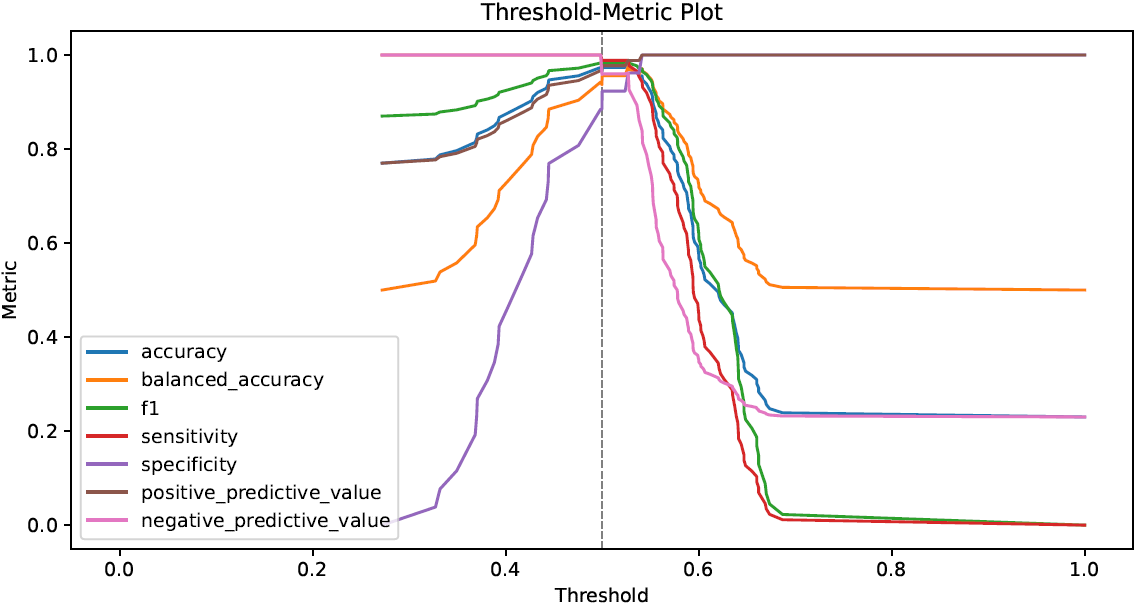
performance metrics in tabular and graphical form
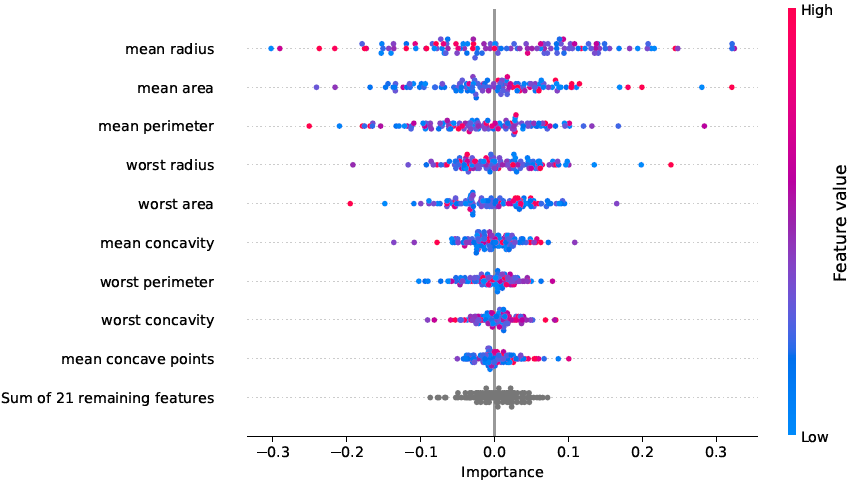
feature importance scores in tabular and graphical form
… and many more.